Diagnosing EV Charger Failures

Introduction
Customer support responses such as "let's reboot it first," "let's go on site and check," or "it might be a relay issue" may work in the early stage of operations, but they quickly reach their limits as the number of chargers grows. Field dispatch costs increase, engineering teams have to track failures that are difficult to reproduce, and operations teams struggle to explain the exact cause to users.
To improve service quality and optimize operational resources, operators need a diagnostic environment that can visualize charger status remotely and identify problems in advance. It is not enough to simply know whether a failure occurred. The system must be able to narrow down at which stage the failure happened.
This article explains how data-driven quantitative analysis can be used to analyze charging start failures and charging interruptions, both of which have an immediate impact on revenue and can significantly harm the service's reputation among users, and how those analyses can provide insights to operations and engineering teams.
Case: Charging Start Failures and Charging Interruptions
A charging start failure is operationally difficult to handle. To the user, the general symptom "charging does not start" looks like a single problem, but in reality, there are many possible causes that can occur across different stages.
- The vehicle is not electrically detected
- The charger fails to provide a normal PWM duty cycle or frequency
- CP measurements fluctuate near threshold values
- CP state determination is unstable due to ADC calibration or measurement errors
- The system reaches the charge-ready state, but the relay does not operate
- The relay closes, but no actual current flows
- Authentication or session start is delayed due to CSMS communication issues
- The vehicle or charger stops the session during charging
- Charging is limited due to temperature or meter issues
To distinguish these problems, we used the CP (Control Pilot) state as a key diagnostic signal.
CP is the basic control signal exchanged between the vehicle and the charger to determine whether charging is possible. By observing the CP state, operators can check whether the vehicle is connected, whether the vehicle has reached the charge-ready state, and whether the charger is providing a normal PWM signal.
When CP state is converted into data, charging failures can be quickly classified as problems before vehicle connection, problems during the charge preparation stage, or problems in the power delivery stage after CP. In other words, CP provides evidence for progressively narrowing down candidate causes rather than relying on vague assumptions.
However, CP does not determine every root cause. CP is a first diagnostic axis that rapidly reduces the set of possible causes. In real operations, CP must be analyzed together with relay, meter, ADC, temperature, and CSMS connectivity metrics.
What We Collected
We designed and collected metrics so the following questions could be answered immediately.
- Did the user actually plug in the connector?
- Did the vehicle reach the charge-ready state?
- Did the charger provide PWM duty cycle and frequency within specification?
- Are the CP measurements reliable?
- Are state transitions repeatedly fluctuating?
- Is the CP voltage outside the normal range?
- Was charging limited or stopped due to temperature conditions?
- Is authentication or session start being delayed due to CSMS communication issues?
For this purpose, the charger collects the following CP-related metrics.
CP State and Signal Metrics
| Metric | Meaning | Operational interpretation |
|---|---|---|
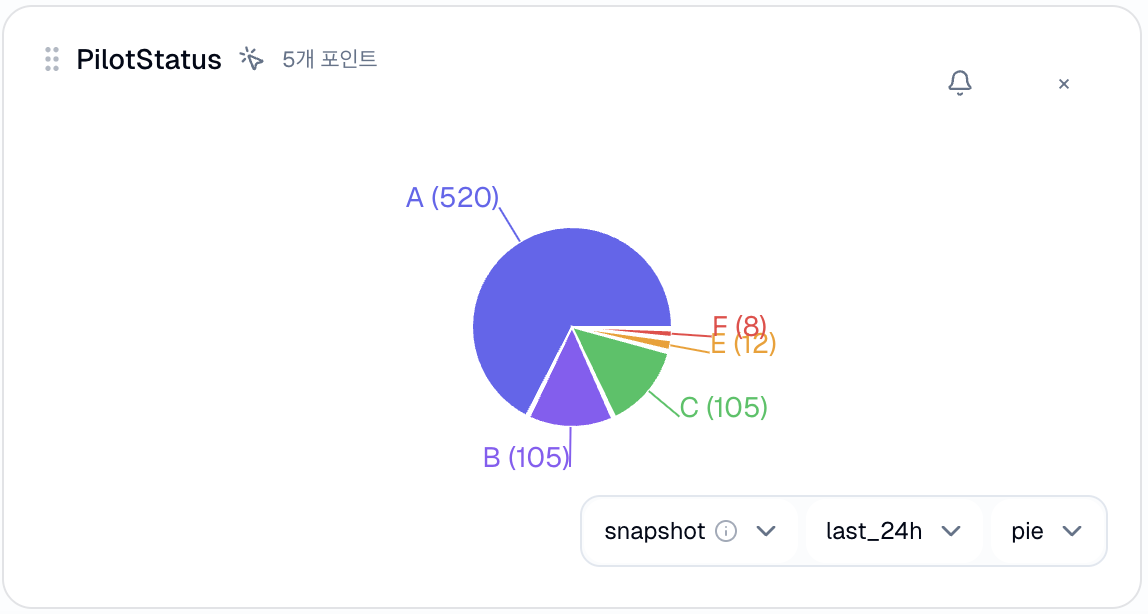
PilotStatus |
Current CP state | Distinguishes vehicle not connected, vehicle connected, charge-ready, and fault states |
PilotMilliVolts |
Measured CP voltage | Checks state determination stability, voltage abnormalities, and calibration issues |
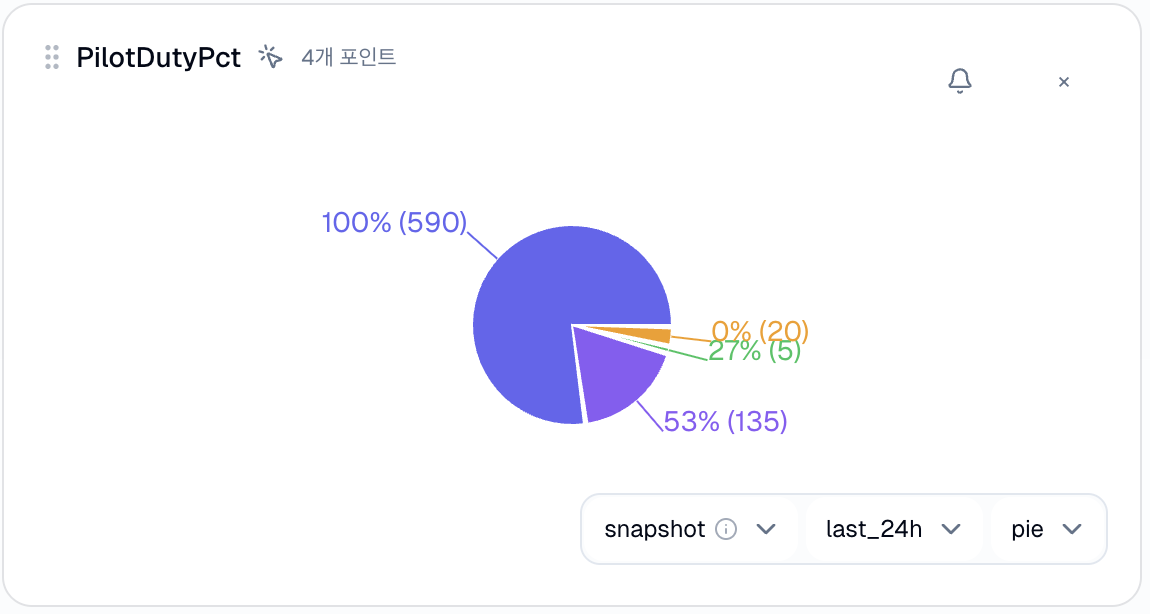
PilotDutyPct |
CP PWM duty cycle ratio | Checks the allowable current level advertised to the vehicle |
PilotFrequency |
CP PWM frequency | Checks PWM generation, timer, and firmware abnormalities |
PilotMeasureCount |
Number of CP measurements | Denominator for measurement reliability and ratio calculations |
PilotDutyErrorCount |
Number of duty calculation or classification errors | Potential abnormality in duty measurement or calculation |
PilotBoundaryValueCount |
Number of measurements near threshold values | Possibility of unstable A/B/C state classification |
PilotAnomalyCount |
Number of abnormal CP patterns | Signal quality degradation or abnormal state |
PilotOutlierCount |
Number of outlier measurements | Potential noise, poor contact, or ADC instability |
These metrics can answer the following questions:
- Was the vehicle connected?
- Did the vehicle reach the charge-ready state?
- Did the charger advertise a normal duty cycle?
- Is the PWM frequency within the normal range?
- Is the CP signal fluctuating near threshold values?
CP Measurement Quality Metrics
| Metric | Meaning | Operational interpretation |
|---|---|---|
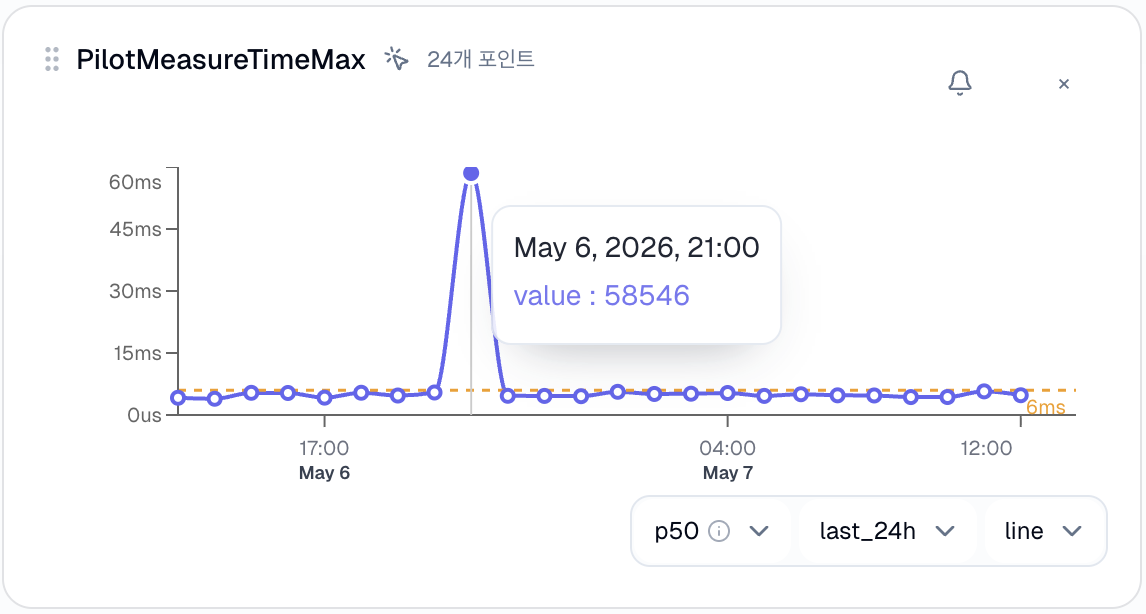
PilotMeasureTimeMax |
Maximum time taken for CP measurement | Potential measurement routine delay or MCU load |
PilotMeasureTimeMin |
Minimum time taken for CP measurement | Baseline for measurement time distribution |
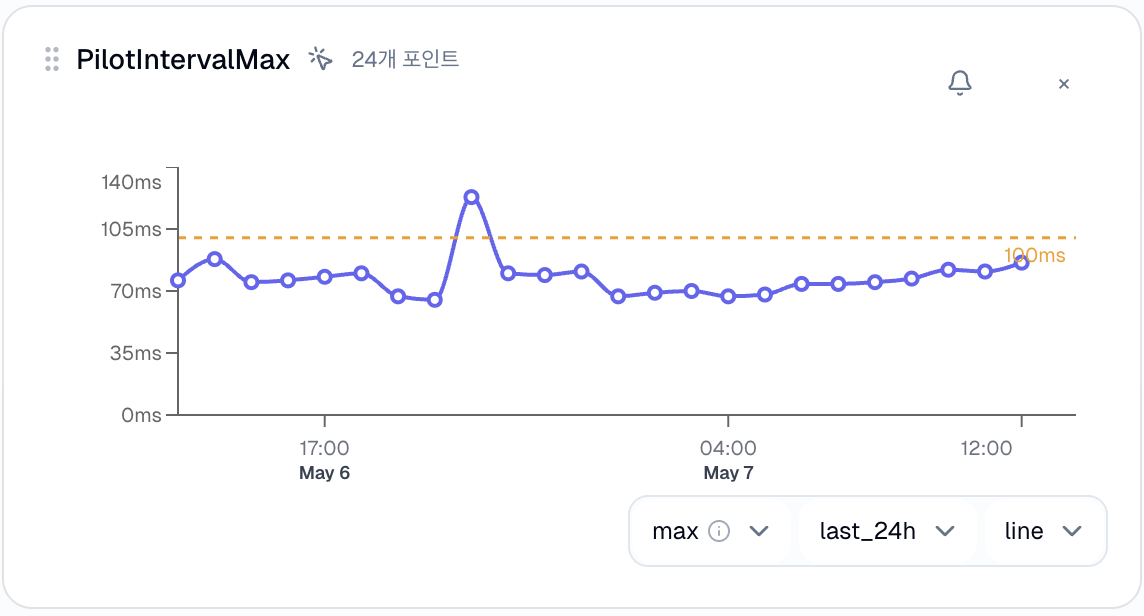
PilotIntervalMax |
Maximum interval between CP measurements | Potential measurement cycle delay or scheduler issue |
PilotIntervalMin |
Minimum interval between CP measurements | Checks measurement cycle stability |
PilotOverrunCount |
Number of measurement routine overruns | Reduced real-time performance, task load, or firmware issue |
PilotReadErrorCount |
Number of CP read failures | Potential measurement path or ADC read issue |
These metrics explain whether CP is being measured correctly, rather than the CP signal itself. This distinction is important because abnormal CP values can have two different causes.
- The actual CP signal is abnormal
- The CP measurement logic or ADC measurement value is abnormal
For example, the following pattern should first lead operators to suspect measurement logic or firmware scheduling issues rather than the connector.
- Increase in
PilotOverrunCount - Increase in
PilotReadErrorCount - Increase in
PilotMeasureTimeMax - Increase in
PilotIntervalMax
Conversely, if measurement quality metrics are normal but only PilotBoundaryValueCount and PilotOutlierCount are repeatedly high on a specific charger, the CP line, connector, grounding, and circuit variation should be examined first.
CSMS / Network Connectivity Metrics
| Metric | Meaning | Operational interpretation |
|---|---|---|
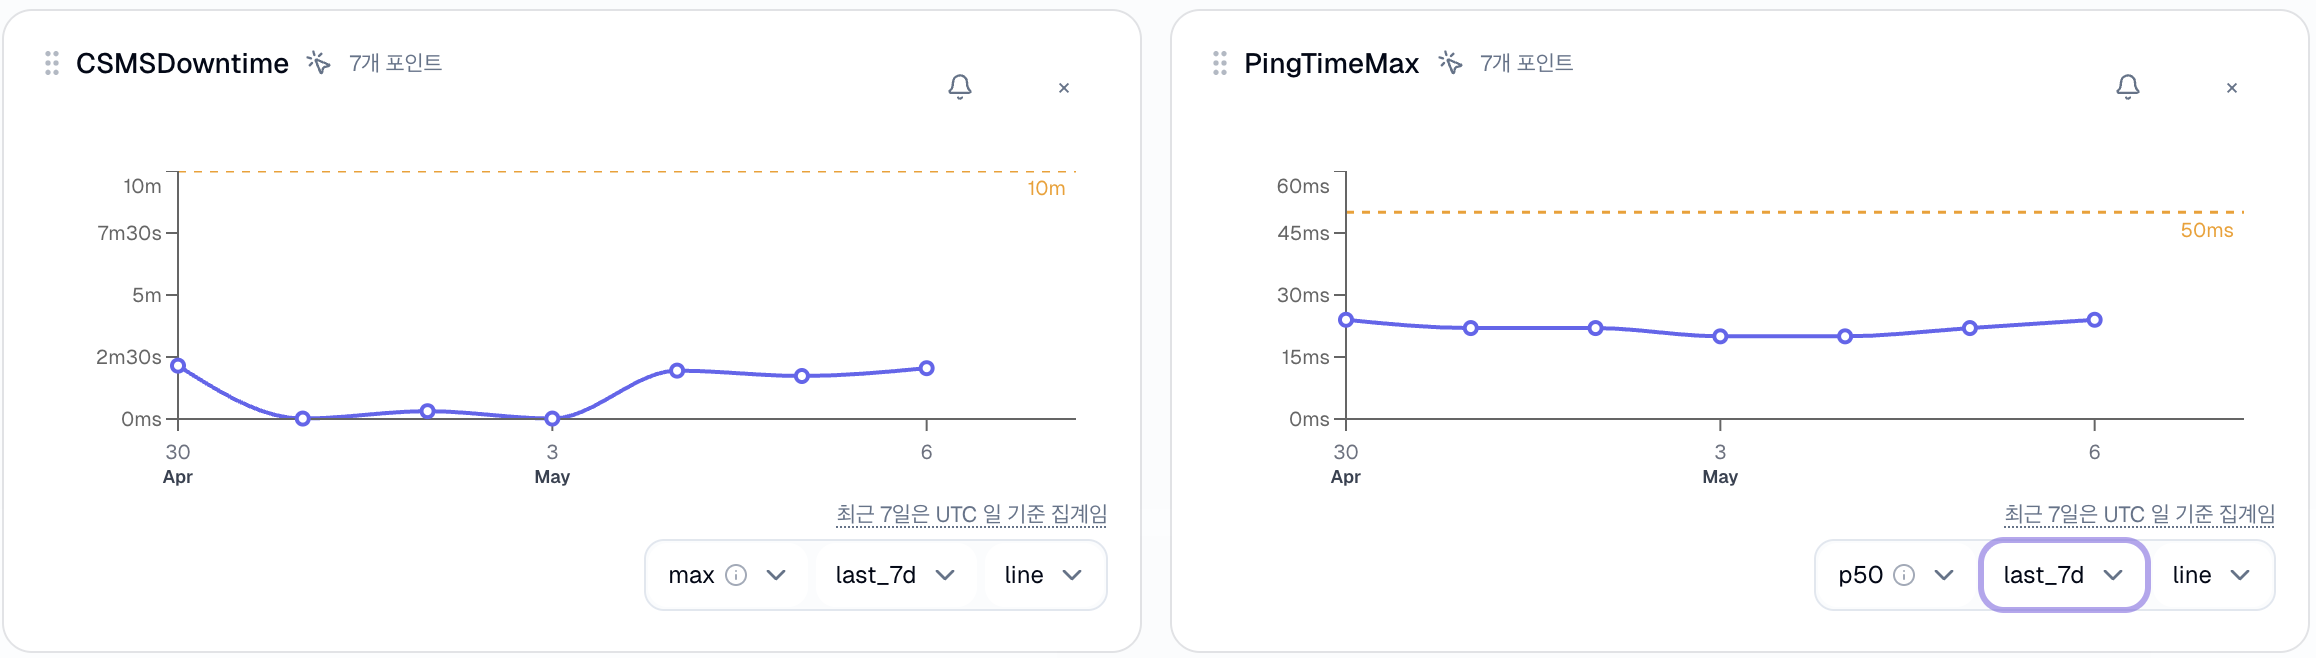
CSMSDowntime |
Duration of unavailable or abnormal connection to the CSMS | Time during which the charger could not communicate normally with the backend |
PingFailureCount |
Number of ping failures | Potential reduced network reachability or unstable line |
PingTimeMax |
Maximum ping response time | Potential latency spike or degraded line quality |
PingTimeMin |
Minimum ping response time | Baseline latency under normal conditions |
Even after the charger confirms vehicle connection and the charge-ready state, it still needs to communicate with the CSMS. OCPP is a protocol for standardizing communication between a charge point and a Charging Station Management System, and in real operations, flows such as authorization, sessions, status management, and remote control depend on CSMS connectivity.
Therefore, even if CP is normal, poor CSMS connectivity can still make the user experience the same symptom: "charging does not start."
Relay Operation Metrics
| Metric | Meaning | Operational interpretation |
|---|---|---|
RelayPickupCount |
Number of relay pickup operations | Initial drive attempts to close the relay |
RelayHoldCount |
Number of relay hold operations | Relay hold operation |
RelayOffCount |
Number of relay off operations | Relay cutoff operation |
RelayPickupDuty |
Drive duty during pickup | Initial relay drive strength |
RelayHoldDuty |
Drive duty during hold | Relay hold drive strength |
Relay metrics are important for diagnosing the stage after CP.
If CP reaches state C, the vehicle is ready for charging. However, for actual charging to start, the relay must pick up normally and remain in the hold state.
For example, the following two situations are completely different cases:
PilotStatus = C
RelayPickupCount unchanged
MeterEnergyDeltaAccumulated = 0
In this case, the vehicle is ready, but the system did not proceed to the relay control stage. Authorization, CSMS control conditions, the state machine, and relay control logic should be examined.
PilotStatus = C
RelayPickupCount increased
RelayHoldCount increased
MeterEnergyDeltaAccumulated = 0
In contrast, this case means the relay operated, but actual energy transfer did not occur. Relay contacts, output path, vehicle OBC, and meter measurement issues should be checked.
State Counters
| Metric | Meaning | Operational interpretation |
|---|---|---|
ChargerStateACount |
Number of entries into state A during the reporting period | Return to vehicle-not-connected state, disconnection |
ChargerStateBCount |
Number of entries into state B during the reporting period | Vehicle connection recognition, reconnection, C-to-B return, possible user retry |
ChargerStateCCount |
Number of entries into state C during the reporting period | Event where the vehicle reached the charge-ready state |
ChargerStateDCount |
Number of entries into state D during the reporting period | Entry into ventilation-required state, exceptional in normal operations |
ChargerStateECount |
Number of entries into state E during the reporting period | Entry into CP fault-related state |
ChargerStateFCount |
Number of entries into state F during the reporting period | Entry into EVSE fault state |
These values are used in two ways.
- To calculate the ratio of state entries.
- As proxy indicators for estimating charging attempts and charging failure types.
The total number of state observations during the reporting period is calculated as follows:
State Sample Total = ChargerStateACount + ChargerStateBCount + ChargerStateCCount + ChargerStateDCount + ChargerStateECount + ChargerStateFCount
Based on this value, each state's ratio can be calculated:
State Ratio = ChargerStateXCount / State Sample Total
This ratio is not the state dwell-time ratio. It shows which state entries occurred most frequently among state entry events during the reporting period.
For example, if there are many B-state entry events, the following possibilities can be considered:
- Vehicle connection recognition is repeating
- The user attempted connection multiple times
- The A/B state is flapping
- The CP signal is fluctuating near threshold values
ADC Error Metrics
| Metric | Meaning | Operational interpretation |
|---|---|---|
ADCErrorPipe |
ADC pipeline error | ADC processing path issue |
ADCErrorConversion |
ADC conversion error | Conversion failure or driver issue |
ADCErrorRead |
ADC read error | Failure to read ADC data |
ADCErrorParam |
ADC parameter error | Configuration value or call parameter issue |
ADCErrorCalibration |
ADC calibration error | Calibration value application or calibration data issue |
ADCErrorSequence |
ADC sequence error | Measurement order or sequence issue |
ADCError |
General ADC error | Aggregate ADC layer error |
A common operational mistake is to immediately treat abnormal PilotMilliVolts values as a CP circuit or connector issue. However, if ADC errors are increasing at the same time, the problem may be in the measurement layer rather than the actual signal.
For example, the following pattern strongly suggests an ADC calibration or measurement path issue.
- Increase in
PilotBoundaryValueCount - Increase in
PilotOutlierCount - Increase in
ADCErrorCalibration - Increase in
ADCErrorConversion
Conversely, if there are no ADC errors but PilotAnomalyCount and ChargerStateECount repeatedly occur only on a specific charger, the CP circuit, connector, grounding, and interaction with the vehicle should be examined first.
Temperature Metrics
| Metric | Meaning | Operational interpretation |
|---|---|---|
TemperatureWarningCount |
Number of temperature warnings | Increase in thermal risk |
TemperatureErrorCount |
Number of temperature errors | Potential protective action or charging interruption |
TemperatureMax |
Maximum temperature | Potential installation environment, cooling, or component degradation issue |
TemperatureSampleIntervalMax |
Maximum temperature sampling interval | Potential temperature measurement delay or task issue |
Charging interruptions should not be explained by CP alone. Even if CP, relay, and meter data are normal, increasing temperature warnings or errors may indicate thermal protection or installation environment issues.
Insights for Operations Teams
Operations teams do not need raw metrics. They need to know, "So what should we do now?"
For example, a daily report like the following can be produced.
Daily CP Operations Report

Total charging attempts: 8,420
Suspected CP-related failures: 276 (3.3%)
Major failure types:
  1. B-state stall: 112
  2. Charge ready but no current: 84
  3. CP flapping: 51
  4. PWM abnormal: 21
  5. E/F fault: 8

Priority action targets:
  - CHG-1023: Repeated zero current in state C -> relay/output/CT inspection required
  - CHG-1182: High A/B flapping ranking -> connector contact inspection required
  - CHG-2041: Increased B-state stall -> PWM/vehicle compatibility/firmware check required
Once this kind of reporting becomes possible, the field dispatch process changes as well. Instead of visiting blindly, teams can go on site already knowing which parts and which logs need to be checked.
Reports for Engineering Teams
Engineering teams ask different questions from operations teams.
Operations teams ask, "Which charger should we look at first?" Engineering teams need to determine, "Is this a product issue, an environmental issue, or a version-specific issue?"
Therefore, engineering reports should be segmented not only by charger, but also by firmware version, hardware revision, site, and installation age.
An example is shown below.
Weekly CP Engineering Report

1. Firmware Regression
  - After deploying v1.8.3, the PWM abnormal rate increased from 0.2% to 1.9%
  - No increase on chargers with the previous version at the same site
  - Possible regression in PWM timer or duty calculation logic
2. Hardware Revision
  - cp_voltage_out_of_range rate is 2.4x higher on HW rev.B than rev.A
  - Voltage is measured lower by a consistent ratio across A/B/C states
  - ADC calibration table or voltage divider circuit variation should be checked
3. Site Pattern
  - Site-17 has a CP flapping rate 3.1x higher than the overall average
  - Other sites with the same firmware/hardware are normal
  - Grounding, power noise, and connector usage environment should be checked
4. Charger Aging
  - A/B flapping increases on chargers installed for more than 18 months
  - Possible connector contact wear or cable stress
This report goes beyond simple failure response and leads to product improvement. It enables early detection of CP voltage deviations in specific board revisions, PWM abnormalities in specific firmware versions, and connector contact issues related to installation age.
Closing
In EV charger operations, charging start failures and charging interruptions directly affect revenue and user experience. However, it is difficult to identify the cause from user reports alone. Behind the same symptom, "charging does not work," there may be many possibilities: connector contact issues, CP signal abnormalities, vehicle readiness failures, PWM advertisement issues, relay control issues, output path issues, and more.
As charger operations scale, what matters is not performing more field checks, but knowing what to check before going on site. CP-based diagnostics are the starting point.
Through Pulse, Pazzk collects these metrics and turns charging failures from a matter of guesswork into a measurable operational problem.